Read this analysis of metal price cycles, including copper, aluminum, lithium and cobalt, featuring insights from Christopher Gilbert of Biena Consulting Srl. It also addresses the significant increase in metals demand from China between 2003 and around 2012
Metals prices are highly variable. Over the fifteen years starting in 2010, the standard deviation of monthly averages of US dollar iron ore prices was 33% (at an annualized rate), very slightly above that of Brent crude oil at 32%. The comparable figures for aluminium and copper were 16% and 17% respectively. By contrast, US automobile prices have a monthly standard deviation of just 1.4%.
These high levels of variability would matter relatively little if price shocks were transient. In fact, they are very persistent. The year-to-year variation of iron ore prices over the period 1961- 2024 was 20%, which compares with 25% for Brent crude oil. The figures for copper and aluminium were 19% and 15% respectively.
Metal price variability of industrially-consumed commodities
The price variability of these industrially-consumed commodities arises from two factors.
First, metals consumption is price-inelastic – industrial consumers have little flexibility in adjusting input requirements without redesigning products and respecifying manufacturing processes.
Second, it takes between five and fifteen years to bring a new mine into production. Mines and smelters will aim to operate at full capacity to cover fixed capital costs with the consequence that excess capacity can overhang the market. Supply responses to price shocks are, therefore, slow. Stocking and destocking provide an important element of stability in aluminium and copper, but iron ore, like crude oil, is expensive to store.
Aluminium and copper are both consumed widely across the manufacturing and construction sectors, so demand conditions are common for the two metals. Short-term price movements are therefore correlated: r = 0.66 monthly (2010-24) and r = 0.55 for annual movements (1961-2024). Price correlations with the other base metals (lead, nickel and zinc) are similarly high.
These correlations suggest we may think of common metals price cycles. Two words of caution are required.
First, demand for precious metals is driven by a different set of factors, and so they exhibit different cyclical patterns. The same is true to a lesser extent of platinum-group metals. Second, these cyclical patterns are irregular and lack the predictability of, say, a cosine function.
High metals intensity of Chinese manufacturing
The very rapid growth in Chinese metals demand from 2003 has resulted in a situation in which mining companies were constantly chasing a moving target. This situation was exacerbated by the strength of Chinese demand in construction and the high metals intensity of Chinese manufacturing, which, at least initially, paid little attention to metals-saving technologies. The prices of copper and other base metals remained abnormally high over fifteen years (with a break in 2009 following the 2008 financial crisis) until production caught up and Chinese growth slowed. Figure 1 charts copper (solid line) and iron ore (broken line) prices over the period 1960-2024.
China was not a major importer of aluminium over this period, so aluminium (the feint line in Figure 1) failed to participate in this movement. In copper, there is a clear parallel between the period of high prices associated with rapid Japanese growth in the late nineteen sixties and the coordinated expansion of the Western economies following the 1971 Smithsonian Accord. High copper prices also followed the Korean War and post-war rearmament from 1951. This has been taken as evidence for the existence of a long-term cycle – the metals “super-cycle” – with a period of between twenty and thirty years.
The statistical problem in analyzing possible long term cycles arises in distinguishing between cyclical movements and changes in the long term price trend. The evidence for the existence of a regular super-cycle evaporates as one extends the data window earlier into the twentieth century and into the nineteenth century.
The metals agenda and the “green energy transition”
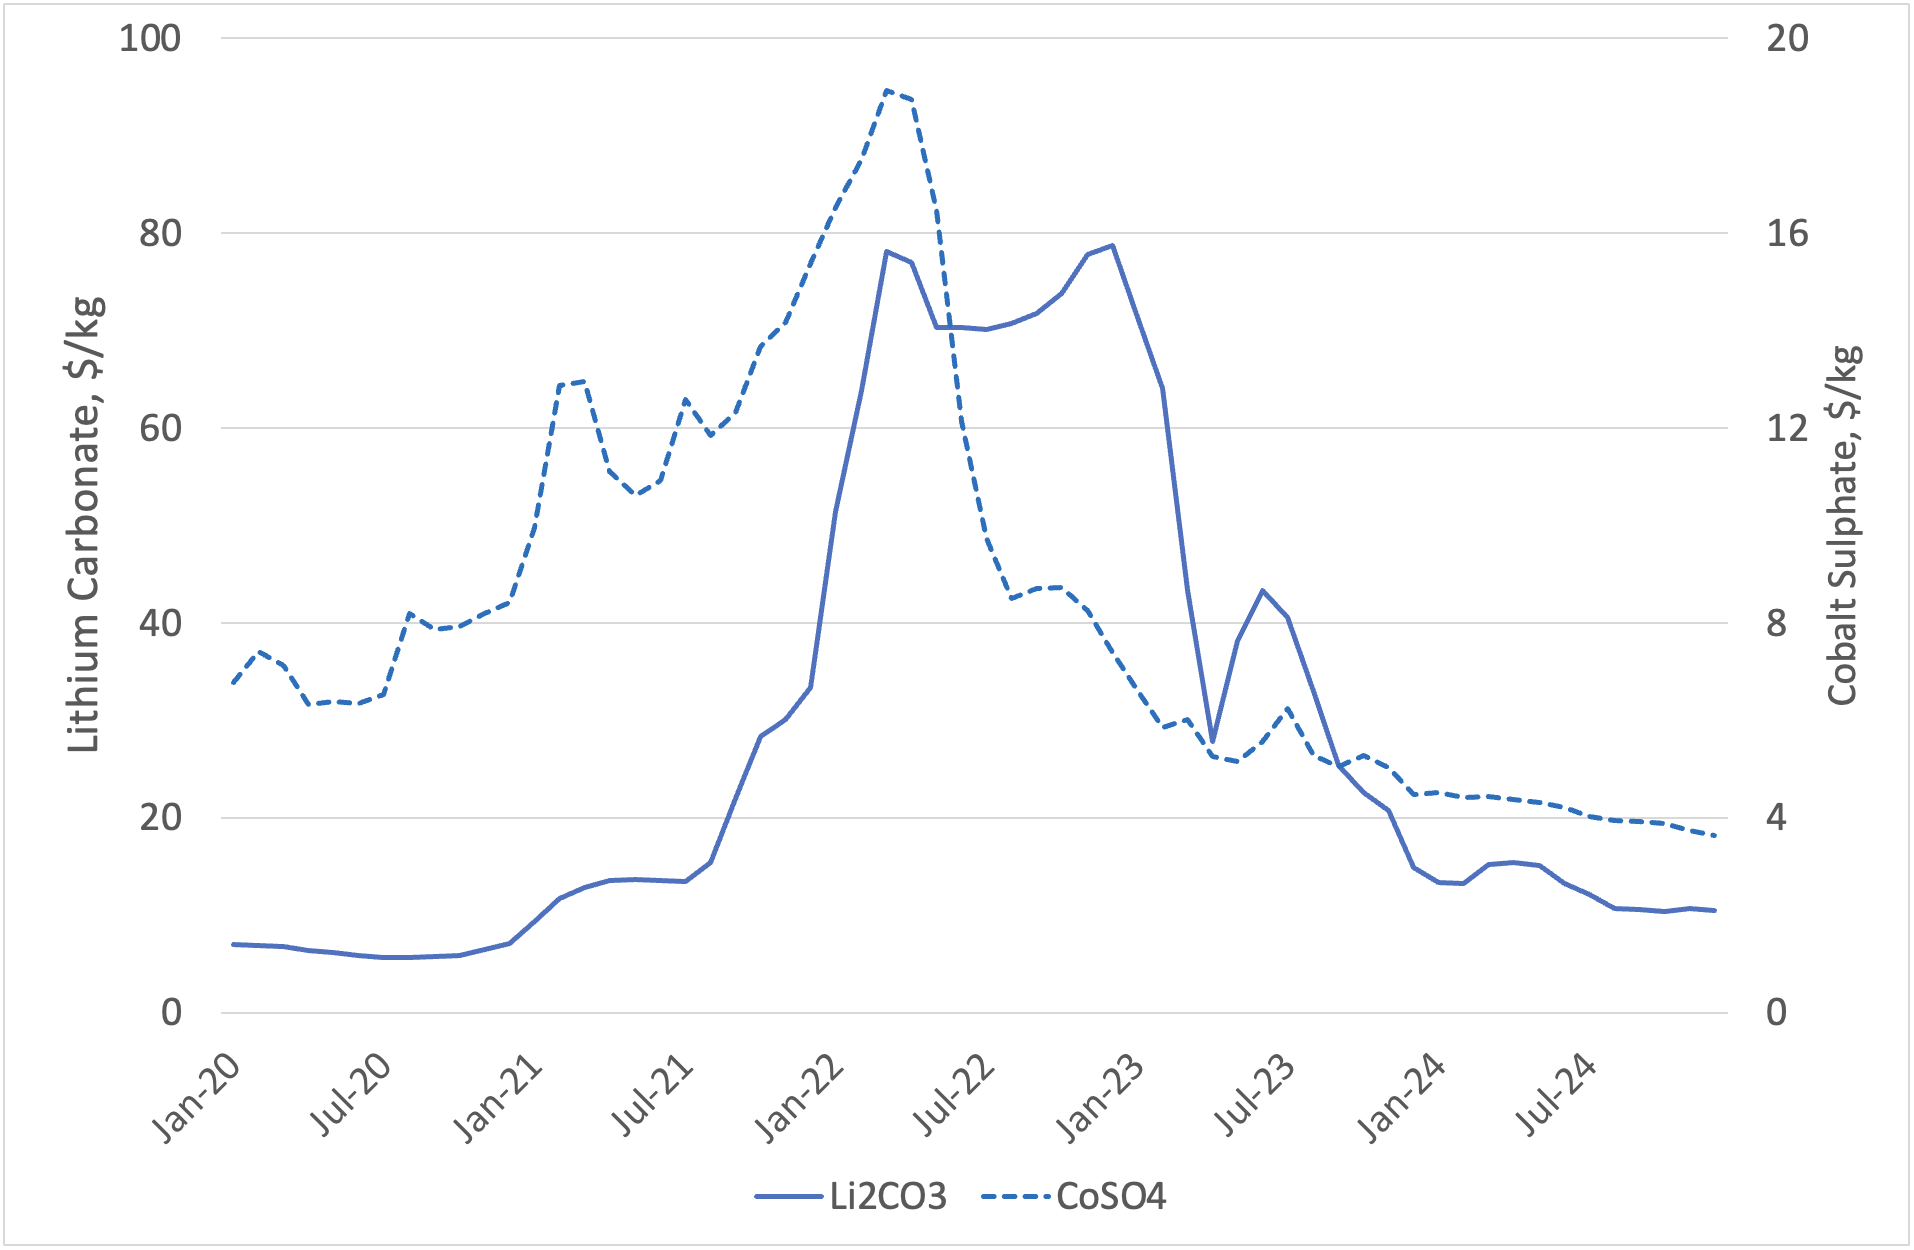
Putting short-term political factors to one side, the metals agenda has come to be dominated by the “green energy transition” and, specifically, battery demand for electric vehicles, renewable power infrastructure and electricity storage. This moves the focus onto the so-called battery metals, of which lithium, cobalt and nickel are the most important. All three metals have seen dramatic price movements over the most recent years – see Figure 2, which charts the ex-China price of Lithium Carbonate (LiCO3, solid line) and Cobalt Sulphate (CoSO4(H20), broken line).
It is better to see these episodes as one-off spikes arising from the large-scale automotive switch from internal combustion engines to battery-powered electric vehicles (EVs) rather than as cycles. There is abundant lithium in the Earth’s crust, in particular in the so-called lithium triangle in northern Chile, the south of Peru and Bolivia, but prior to the EV revolution these reserves were not intensively exploited.
Cobalt is less easily available but can also be substituted in some battery technologies. The rapid increase in demand in 2020-21 as the world emerged from the Covid pandemic led to sharp prices in the price of both metals – lithium rose by a factor often and cobalt by a factor of three. Both prices fell back equally dramatically in 2023 as new mines were developed and advances in battery technology reduced requirements.
Reference
- Nominal U.S. dollars. Source: https://www.worldbank.org/en/research/commodity-markets U.S. new automobile prices are from https://fred.stlouisfed.org/series/CUURX000SETA02
- US dollars deflated by import unit values. Source: https://www.worldbank.org/en/research/commodity-markets
- Prices are DAP, China. Source, DataLab, CRU Group Ltd. https://www.crugroup.com/en/solutions/datalab-api/