Tom Hengl, Director of the OpenGeoHub foundation, discusses the importance of soil health monitoring and how the AI4SoilHealth project is supporting this endeavor
Soils are the basis of human civilization. Together with biodiversity, climate, and water resources, it is our primary natural capital that we have inherited and should never underestimate or mistreat: 1cm of soil can take between 200–400 years to form under natural conditions, hence any soil degradation (e.g., soil erosion, landslides, salinization, flooding, sealing, loss of biodiversity and similar) means we are throwing away the future of our children and their children. Soil health monitoring is thus a fundamental activity and an important requirement for reaching the European Green Deal and the UN’s Sustainable Development Goals.
Soil health is not the same as human health, of course. You can’t take your soil to the doctor, take blood samples, and know if there are any health issues the next day! Today, several companies sell (fashionable) rings that can be used to track human health. For example, the Samsung Galaxy Ring has an ECG sensor that measures blood pressure, temperature, sleeping patterns, vitality, steps, etc. One can have a full monitoring and warning system that sends information directly to your mobile phone for a few hundred dollars. We currently do not have anything comparable to monitor soils, at least not at a comparable price. This is why we have kickstarted the AI4SoilHealth project — to connect the leading European research organizations and try to provide solutions and data that can help boost the development of easily accessible tools for everyone (note: AI4SoilHealth is officially an open data and open source project: all main outputs of the project will be released under open data license, with DOI and full metadata).
We do not yet have small gadgets for soil health monitoring and measuring; however, luckily, two advanced technologies do exist that could help make soil health monitoring a success:
1. Remote sensing technology
- i.e., space-based Earth Observation systems focused on the state of the environment: the open data EO systems such as Landsat and Copernicus Sentinel are especially important.
2. Soil spectroscopy,
- i.e., Vis-NIR and MIR (Mid-Infrared) scans of soil samples in situ or dried samples in the lab.
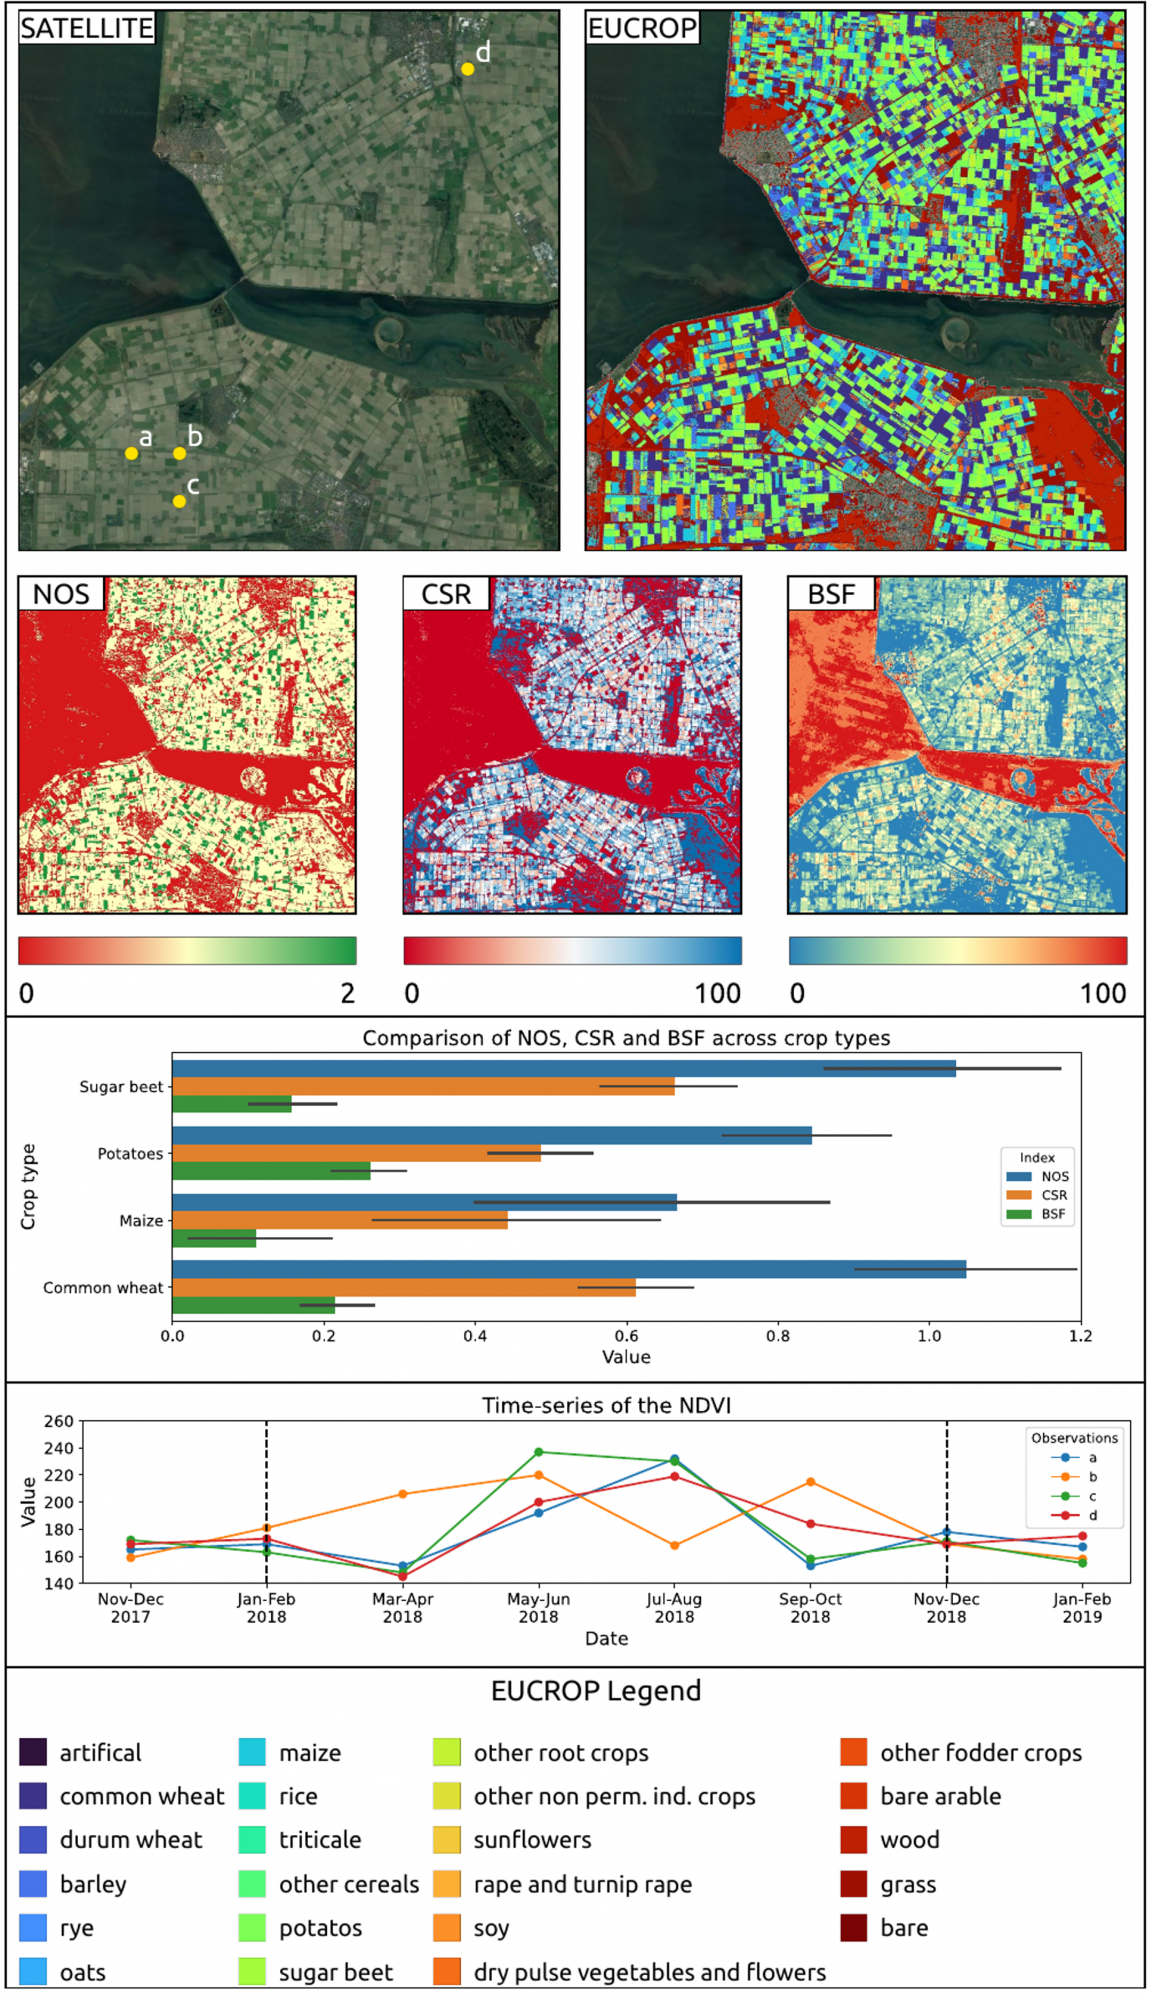
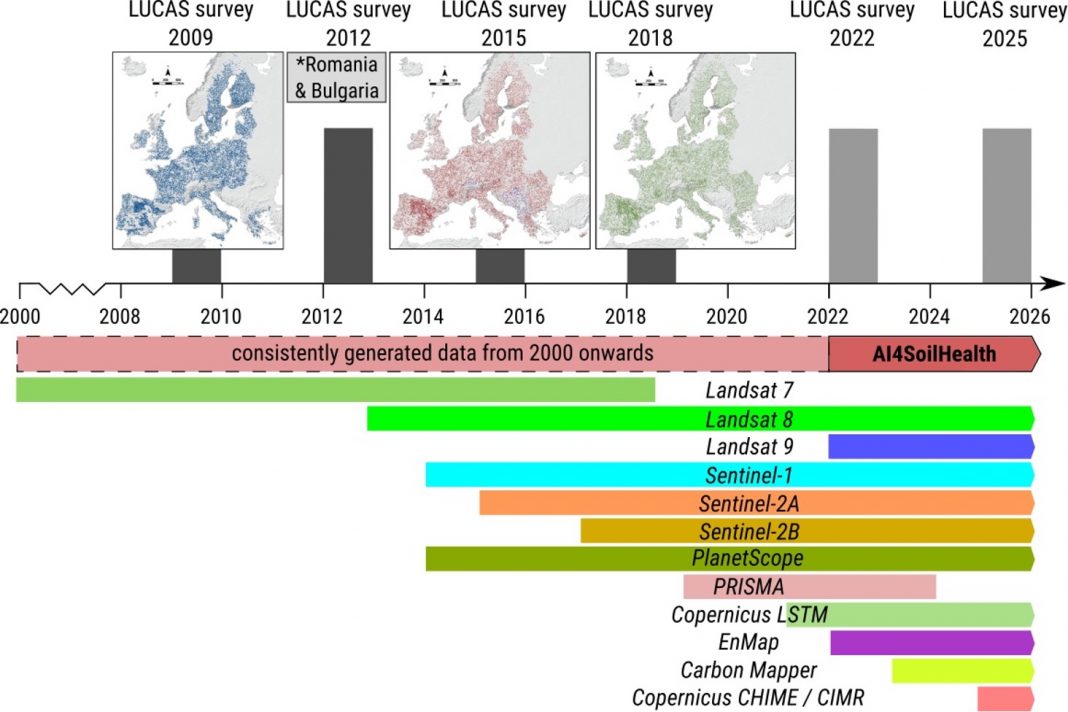
Landsat images are available from 1985 (at a higher quality from 1997) at a spatial resolution of 30m and hence cover 30+ years of bi-weekly images of any place on Earth (apart from the poles). Landsat images cannot be used to estimate soil health directly. However, they can be used to derive various biophysical indices that can be used to estimate various soil degradation or soil restoration processes. OpenGeoHub and partners have specifically focused on preparing the Landsat monthly and bimonthly cloud-free and complete, consistent time series of images and biophysical indices, such as vegetation indices, bare soil fraction, and tillage index. This data needs to be organized in a seamless data service: for EO, this is today referred to as a ‘data cube’ — highly organized data infrastructures enabling users to run new analyses and generate insights into processes, patterns, and trends. On the one hand, more EO data today can be used to track the state of the environment, even during cloudy days. On the other hand, increasingly more soil samples are being made available for pan-EU mapping. It is especially important to emphasize the European Commission’s LUCAS soil program, which has already generated over 100,000 samples covering 2009, 2012, 2015, 2018, and 2022 with detailed laboratory measurements of some 15+ variables.
One of the main deliverables of the European AI4SoilHealth project is a ‘Soil Health Data Cube’: a compilation of pan-EU layers organized and served through an API as analysis or decision-ready data with most of the data comprising a time-series of images, e.g., bimonthly NDVI, annual soil organic carbon, monthly rainfall and similar. It will be published via the EcoDataCube.eu infrastructure and served with unrestricted access as a genuine open data project comparable to Copernicus Land Monitoring services, Zenodo.org, and similar. It will primarily serve the EU Soil Observatory hosted by the European Commission JRC. It will comprise EU-wide bimonthly primary and secondary soil properties, land degradation indices, terrain parameters, and similar EO products, all at 30m resolution and encompassing the period 2000–2023+.

The seven-step assessment of soil health
To ensure robust soil health monitoring and to be able to detect any negative trends or changes on time, it is important to get the right framework. One framework we are testing within the AI4SoilHealth is the seven-step assessment of soil health:
1. Assess the history of a site (last 30+ years based on the Landsat-derived Soil Health Data Cube) and provide answers to questions, e.g.:
- a. How much soil organic carbon (SOC) has been gained/lost over the last 30 years?
- b. Which chemical and physical soil properties changed the most?
- c. Is there any land/soil degradation, and how significant is it?
- d. How has agronomic management impacted soil health?
- e. How much did the land cover/ vegetation cover change? What is the main land use change class?
- f. How much did the landscape heterogeneity change over time?
2. Determine the current state of soil (actual year):
- a. What is the current state of physical and chemical soil properties?
- b. What are the current (WRB) soil type/main soil forming processes and soil states?
- c. What are the current derived soil properties?
- d. What are the current macronutrient stocks in the soil?
3. Determine soil potential (next ten, 20, 30 years):
- a. What is the SOC sequestration potential of this soil?
- b. What is the agricultural potential of this soil?
- c. What are the other potential ecosystem functions that provide some land use change or mitigations?
4. (Optional) Collect extra soil samples, send them to the lab, and add to training points:
- a. Generate a sampling design that helps increase mapping accuracy. Optimize the number of samples while taking into account the costs of sampling.
- b. Collect new samples and send them to the lab.
5. (Optional) Import new local data, then re-analyze and reassess points 1, 2, and 3.
- a. Import new local samples/results and add them to the training points. Re-assess local prediction accuracy.
- b. Re-predict layers in the soil health data cube for steps #1, #2, and #3.
6. Suggest concrete Key Performance Indicators (per farm/land unit, thus site-specific):
- a. Provided that soil potential assessment reveals a significant gap between potential and actual.
- b. Either directly provide concrete measures to help increase soil health and/or provide links to documents/organizations that can help increase soil health.
7. Track progress per farm and re-assess if required:
- a. Every one to two years, update the indicators (pan-EU).
- b. Compare with the planned transition in #6. If necessary, recommend re-assessment.
With this framework, we are doing an iterative analysis of the soil’s past, present, and future until we can understand the main processes and drivers and separate seasonal oscillations from long-term trends. This framework is, in principle, similar to assessing human health, where a patient visits a doctor. The doctor first checks the patient’s history, orders additional tests, and then suggests therapy and monitors its progress after the tests are complete.
We hope the highest quality EO time series covering 2000–2024+ will seamlessly integrate with soil laboratory samples. AI technology will be the key to modeling and understanding the complex relationships between soil, climate, land use, and vegetation/living biota. In summary, soils are fragile ecosystems and deserve much stricter conservation policies than we have today. Still, soils also hide much potential and could be vital to fighting the climate change risks (through soil carbon sequestration), ensuring water quality, biodiversity pools, and green and productive landscapes.


This work is licensed under Creative Commons Attribution-NonCommercial-NoDerivatives 4.0 International.


