A new flood-mapping tool, containing data from 1985 to now, could be what the Global South needs for agricultural planning that protects food security
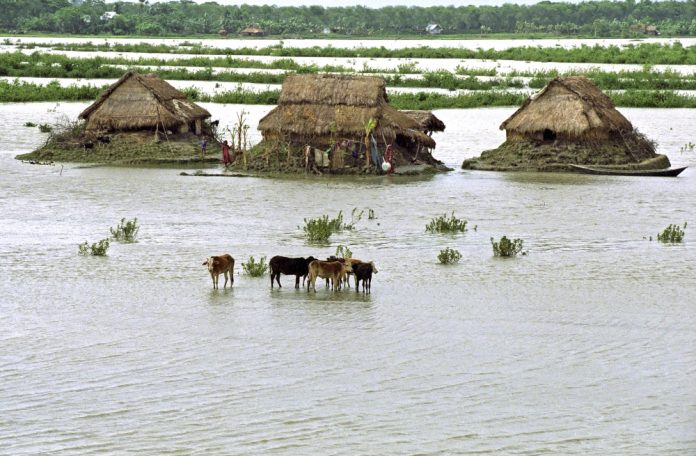
The new data source is the first comprehensive source of flooding information globally. This will be particularly relevant for the Global South, where agricultural output and food security are directly connected to rainfall levels.
According to one study, tropical rainfall will be drastically impacted by climate change – leading to new levels of flood risk, disaster possibility and food insecurity for people in those regions.
“The complexity of the Earth system is daunting, with dependencies and feedback loops across many processes and scales,” said Efi Foufoula-Georgiou, UCI Distinguished Professor of Civil & Environmental Engineering and the Henry Samueli Endowed Chair in Engineering.
The existence of contemporary and past data on how flooding works will provide crucial insight into how to plan agriculturally, how to prevent human life from being lost to intensive flash floods and how to negotiate the ongoing impact of climate change.
The World Flood Mapping Tool uses the Google Earth Engine combined with decades of Landsat data since 1985, creating a vast catalogue of geospatial data enabling planet-scale analysis capabilities.
1.5 billion people live at risk of flood disaster
UNU-INWEH Director Vladimir Smakhtin, said: “Floods in the past decade have impacted the lives of more than half a billion people, mainly in low and middle income countries, and resulted in damages of nearly US $500 billion — roughly equal to the GDP of Singapore. More recent floods worldwide have added to a fast growing toll of upended lives, damage and deaths.
“An estimated 1.5 billion people – greater than the population of Europe – live at risk of exposure to intense flooding.
“We need to prepare now for more intense and more frequent floods due to climate change and hope this tool will help developing nations in particular to see and mitigate the risks more clearly.”
urban areas are expected to grow 80% by 2030
When it comes to non-agricultural planning, this data becomes extra crucial for Africa and Southeast Asia – where urban areas are expected to grow 80% by 2030. This means that populations will need a detailed understanding of which areas would be dangerous to live in.
“Painting a detailed picture of the historical and potential flood risk areas will be invaluable for any urban and regional planning department,” said project collaborator Dr Duminda Perera of UNU-INWEH.
The flood-mapping tool, which needs nothing but the internet to work, can be found here.


