
Dr Karen Bemis from Department of Marine and Coastal Sciences, Rutgers, The State University of New Jersey gives a fascinating explanation of how oceans are heated by volcanic ridges and seamounts
Have you ever wondered what controls the temperature and the chemistry of the deep ocean? If you are interested in climate change, you should. Many factors, including dense surface waters that sink to the depths, can affect the deep ocean temperature and chemistry. One of the most surprising and spectacular controls on deep ocean temperature and chemistry are the volcanic hot springs that line the mid-oceanic ridges and cap seamounts providing chemosynthetic energy to support fantastic ecosystems. These hot springs transfer sufficient heat and chemicals into the ocean to affect the deep ocean circulation patterns, the ocean chemistry (for example, the dissolved Fe content), and the biomass productivity of the ocean. (1)
In volcanic systems under the ocean, seawater infiltrates deeply into the fractured crust warming up due to heat from magma and reacting with the crustal rocks. This altered hot seawater rises back to the seafloor forming hot springs. Some of the hot water forms and exits from sulfide chimneys, creating rising plumes. Other hot water mixes with cold seawater below the seafloor and exists through cracks in the seafloor and porous sulfide deposits forming lower temperature distributed deposits and supporting extensive communities of microbes and animals.
Measuring the heat flux transferred by such fluids is critical to both understanding how seafloor hydrothermal venting works and to quantifying the amount of magmatic heat transferred into the ocean over time. (2) The Cabled Observatory Vent Imaging Sonar, known as COVIS, detects and measures such fluxes and their spatial distribution using a multi-beam sonar from a stationary platform to measure backscatter and phase variations within a 3D volume. (3)
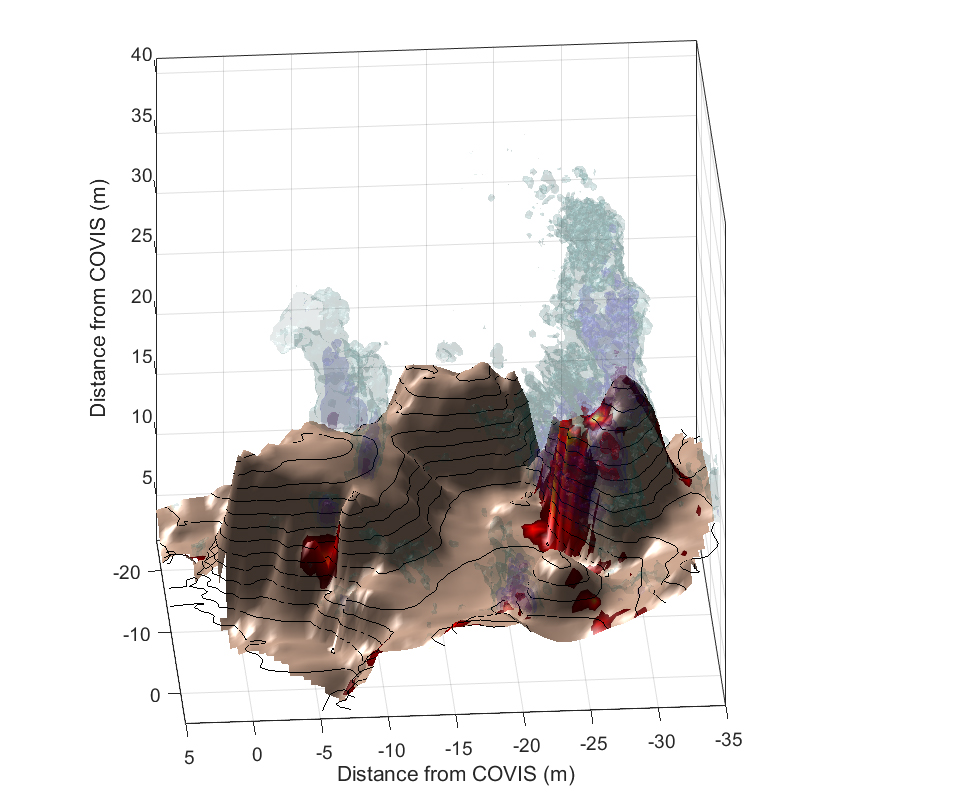
COVIS emits sound which is scattered by particles and rapid turbulent changes in temperature; COVIS records the amount and locations of backscattered sound. Because COVIS is a multi-beam instrument, each ping of sound covers a fan-shaped area; mechanical rotation is used to control the orientation of the fan. This results in information on the amount and phase of backscattered sound from every point within a 50m x 50m x 50m volume, creating an image of plumes rising from hot springs within that region of seafloor. Detailed waveform information is combined with the observed plume geometry to infer vertical variations in rising speed and the overall heat transferred. COVIS also operates in an alternate mode which produces a map of hot spring incidence on the seafloor over a 50m x 50m area.
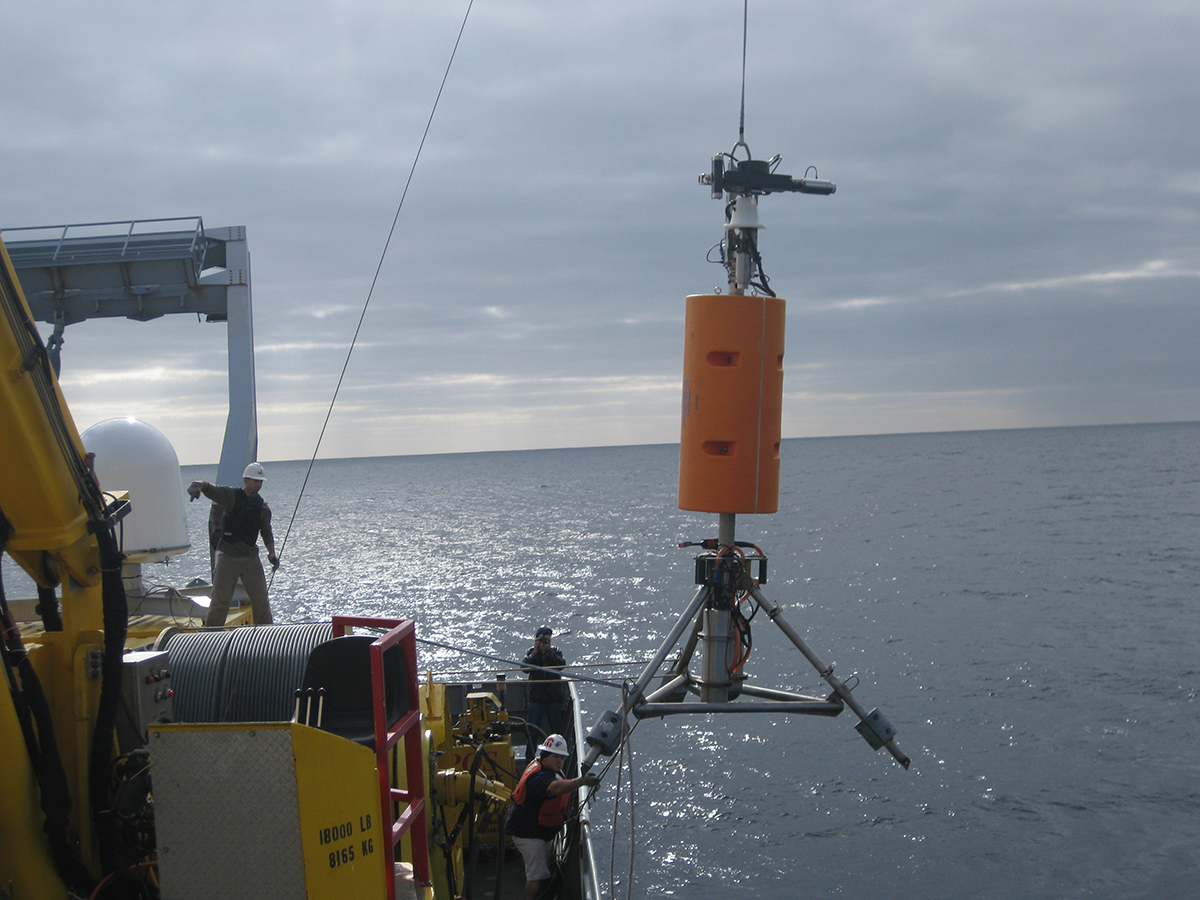
In 2010, a joint team of scientists and engineers from Rutgers, The State University of New Jersey, and the University of Washington worked with Ocean Networks Canada to attach COVIS to their underwater cabled observatory which extend to sites on the northern part of the Juan de Fuca Ridge, more than 100 km off the coast of British Columbia. (4) From 2010 to 2015, COVIS monitored the heat transferred by a small hydrothermal vent called Grotto Vent. During this period, the average heat transfer rate of 20 MW changed little reflecting the very low rates of even tiny earthquakes. (5) Researchers suspect that heat transfer rates would be higher during times of greater earthquake or volcanic activity.
After extensive refurbishing, COVIS is soon to be installed in a new location for monitoring heat from seafloor hot springs: COVIS will be connected to the US National Science Foundation’s Cabled Array node in the ASHES vent field in the caldera of Axial Volcano, which erupted in 1998, 2011 and 2015. (6) The COVIS scientists and engineers are hoping to observe changes in heat and the distribution of hot springs during a volcanic eruption.
References
1 – German, C. R., Casciotti, K. A., Dutay, J.-C., Heimbürger, L. E., Jenkins, W. J., Mills, R. A., Obata, H., Schlitzer, R., Tagliabue, A., Turner, D. R., and Whitby, H. (2016). Hydrothermal impacts on trace element and isotope ocean biogeochemistry. Phil. Trans. R. Soc. A, 374(2081), 20160035.
2 – Bemis, K., Lowell, R., and Farough, A. (2012). Diffuse flow on and around hydrothermal vents at mid-ocean ridges, Oceanography, 25(1), 182-191, http://dx.doi.org/10.5670/oceanog.2012.16.
3 – Bemis, K. G., Silver, D., Xu. G., Light, R., Jackson, D., Jones, C., Ozer, S., Liu, L., The path to COVIS: a review of acoustic imaging of hydrothermal plumes. Deep Sea Reseach Part II: Topical Studies in Oceanography, 121, 159-176, doi:10.1016/j.dsr2.2015.06.002, 2015.
4 – Xu, G., K. Bemis, and D. Jackson (2017), Sounding the black smoker plumes, Eos, 98, https://doi.org/10.1029/2017EO086289. Published on 10 November 2017.
5 – Xu, G., Jackson, D. R., Bemis. K. G., and Rona, P. A., Time series measurement of hydrothermal heat flux at the Grotto mound, Endeavour Segment, Juan de Fuca Ridge, Earth and Planetary Science Letters, 404, 220-231, 2014.
6 – Chadwick, W. W., Jr, J. B. Paduan, D. A. Clague, B. M. Dreyer, S. G. Merle, A. M. Bobbitt, D. W. Caress, B. T. Philip, D. S. Kelley, and S. L. Nooner (2016), Voluminous eruption from a zoned magma body after an increase in supply rate at Axial Seamount, Geophys. Res. Lett., 43, 12,063-12,070, doi:10.1002/2016GL071327.
Please note: this is a commercial profile
Dr Karen Bemis
Department of Marine and Coastal Sciences Rutgers, The State University of New Jersey
Tel: +1 848 932 3384


Anyone EVER tried to measure CO2 emissions from underwater vents and /or volcanos? Rhetorical question, as I presume it is impossible with current equipment, CO2 being so extremely soluble in salt water at high pressure and low temperature, it would immediately be absorbed , to be released in natural upwellings some hundreds of years later.
Thank you for your comment. Please contact bemis@marine.rutgers.edu for any answers you require.