Martin Sharp Department of Earth and Atmospheric Sciences, University of Alberta, provides more compelling commentary on the changing arctic ice caps, focussing on the insights to be gained from ice cores
Previous articles in this series have discussed the changes that glaciers and ice caps in the Arctic have undergone during the recent period of direct field observations and the acquisition of imagery and geophysical measurements from airborne and/or spaceborne platforms. Aerial photography of ice caps extends back over a period of 60 years or so, while satellite imagery and geophysical measurements cover the last 20-30 years. Nonetheless, while the resulting data do a good job of documenting change, they are generally less successful at explaining it due to the paucity of in situ field measurements of key processes and their effects.
However, it is now possible to draw upon the results generated by global and regional climate models, and by climate reanalyses (in which climate model runs are combined with field observations to simulate past climate conditions in areas of interest) to help with this task (e.g. Bezeau et al., 2014). Even so, these datasets are generally coarsely resolved in space (relative to the smaller ice caps in particular) and, to ensure their reliability, they should ideally be subjected to validation against data collected on the ground (which should be independent of the data used in the climate reanalyses) to ensure that they truly represent conditions on the ice caps and glaciers (e.g. Sharp et al., 2011). Unfortunately, in the Arctic, the data required to do this are typically sparsely distributed, of limited duration, and often discontinuous.
The available longer-term datasets are usually from locations off the glaciers and ice caps and need to be calibrated against on-ice meteorological and snow/ice accumulation/melt data. Whilst it is possible to maintain on-ice weather stations that can provide such data for the long-term, this requires a significant investment of time and funding, and the effort faces significant challenges. These include riming-up of sensors, damage to instruments and the platforms on which they are mounted by Polar Bears and Arctic Foxes, sustaining a continuous power supply through the Polar night, and even complete burial of stations by winter snowfall and snow drifting (especially where annual station visits are not possible). At least annual servicing and maintenance are required to ensure the collection of long-term records and methodological consistency is best achieved when the same observer has responsibility for data collection over the long-term, which is often not possible.
Climate records
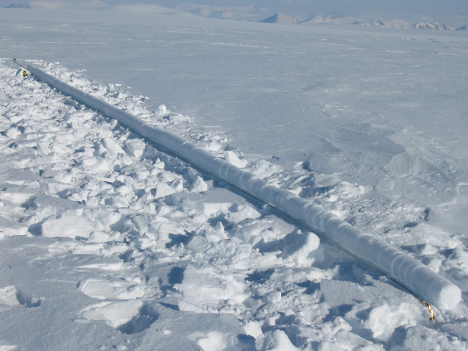
As a result, researchers have often turned to using proxy climate records to document both how the climate over Arctic ice caps and glaciers is changing and how the changes observed are changing the glaciers. Ice cores have become a tool of choice for this purpose because they can provide direct evidence of how the properties of the snow, firn and ice within the glacier have changed over time as the climate has fluctuated (Fisher et al., 2012, Bezeau et al., 2013). For example, during periods with unusually warm summers, surface melting may spread to higher elevations on an ice cap. The resulting meltwater will percolate down into the subsurface snow and firn and will eventually freeze to produce well-defined ice layers or ice bodies in the sub-surface (Figure 1). The freezing also results in the lease of latent heat that warms the firn in the area where freezing occurs (Bezeau et al., 2013). This warming can be tracked over time using strings of thermistors that are installed within a borehole.
The longer the warming persists, and the more intense melting becomes, the more ice is likely to form by refreezing within the snow and firn. Thus, repeat ice coring at a given location over time is an excellent way to track how melt intensity changes over time at a core location. In a 2013 paper, Bezeau and colleagues compared the properties of the firn in 20 shallow cores collected from elevations between 1400 m and 1900 m a.s.l. on the Devon Island Ice Cap in Arctic Canada in 2012 with those of 34 ice cores collected from the same locations in the period 2004-2011. He found a 13-80% increase in the mean density of the upper 2.5 m of the firn layer between 2004 and 2012 and argued that this densification alone would have thinned the firn layer by 0.021-0.168 m a-1 over that seven-year period. Measurements, by airborne laser altimetry, of changes in the surface elevation of the ice cap in this region over the same time period indicated that the ice cap thinned by between 0.077 and 0.252 m a-1 from 2004 to 2012.
Clearly, a large part of this was due to compaction/densification of the firn in a warming climate, rather than to an increase in mass loss from the region by surface melting. Bezeau also reported an increase of 3.88ºC in the temperature of the firn between 2004 and 2012 of which 1.08ºC was attributable to a rise in the mean annual air temperature over the period and 2.58ºC to the release of latent heat by refreezing of meltwater in the firn. These changes in the physical and thermal characteristics of near-surface firn on the Devon Ice Cap provide a graphical illustration of how rapidly the temperature regime and patterns of meltwater flow and storage in firn in these regions may change. The build-up of ice layers within the firn (Figure 1) likely restricted deep percolation of summer meltwater into the firn and promoted horizontal runoff from the higher elevation regions of the ice cap.
Bezeau’s work on recent changes in the physical and thermal properties of the firn layer on Devon Ice Cap complements a study of a core taken from the Agassiz Ice Cap on Ellesmere Island by David Fisher and others (2012) that provides a record spanning the last 10,000 years. This record suggests that melt rates on ice caps in Arctic Canada since the mid-1980s were likely the highest to have occurred in 2,000 years and that, at the Agassiz ice cap site, they were the highest recorded in 4,200 years. Melt rates on the Agassiz ice cap since the mid-1990s were likely last exceeded over 9,000 years ago during the most recent large-scale deglaciation of the Canadian Arctic Islands. Thus, studies of ice cores have documented both ongoing rates and processes of glacier change in the Arctic, and demonstrated how current rates of change compare with rates that occurred in the past.
Material deposits
In addition to recording past changes in air temperature and glacier melt rates, ice cores also contain information regarding materials that have been deposited onto ice caps and glaciers from the atmosphere. Once deposited onto ice cap surfaces, these materials are buried by subsequent snowfall and incorporated into, first, the firn layer on the ice cap surface and then, as they are buried more deeply by continuing snowfall, into the glacier ice itself. Hence, analyses of ice cores can provide both short and long-term records of what has been deposited from the atmosphere, and inventories of the archive of natural aerosols and pollutants that are contained in the ice and that will eventually be released back into the environment by continued melting. These include wind-blown dust, sea-salt aerosols, the fallout from volcanic eruptions, trace metals (such as lead from leaded gasoline), radioactive fallout from atmospheric nuclear weapons testing, particulate products of biomass burning, and aerosols such as sulphate and nitrate that have both natural and anthropogenic sources. They also include a range of both current-use and “legacy” organic contaminants, some of which have the potential to bio-accumulate in the food chains of aquatic ecosystems located downstream from melting ice caps if they are released back into the environment by melting of firn and ice exposed at or near the glacier surface.
References
Bezeau, P., Sharp, M. and Gascon, G. 2014. Variability in summer anticyclonic circulation over the Canadian Arctic Archipelago and west Greenland in the late 20th/early 21st centuries, and its effect on glacier mass balance. International Journal of Climatology. doi: 10.1002/joc.4000.
Bezeau, P., Sharp, M., Burgess, D. and Gascon, G. 2013 Firn profile changes in response to extreme melting in the 21st century at Devon Ice Cap, Nunavut, Canada. Journal of Glaciology 59, 981-991.
Fisher, D., Zheng, J., Burgess, D., Zdanowicz, C., Kinnard, C., Sharp, M. and Bourgeois, J. 2012. Recent melt rates of Canadian Arctic ice caps are the Highest in many Millennia. Global and Planetary Change 84-85, 3-7.
Sharp, M., Burgess, D.O., Cogley, J.G., Ecclestone, M., Labine, C., and Wolken, G.J. 2011. Extreme melt on Canada’s Arctic ice caps in the 21st century. Geophysical Research Letters 38, L11501, doi:10.1029/2011GL047381.
Please note: This is a commercial profile


