Stephen F. O’Byrne, President of Shareholder Value Advisors Inc., provides an insightful analysis of the current state of U.S. executive pay
The basic objectives of executive pay have been the same since the rise of large corporations in the late 19th century. Shareholders want to give managers strong incentives to increase shareholder value while retaining key talent and limiting shareholder cost. Today, it’s widely accepted that these three objectives can be achieved by managing two dimensions of executive pay: the percent of pay at risk and the company’s target pay percentile.
The widely accepted theory is that a high percent of pay at risk provides a strong incentive, and a target pay percentile, for example, 50th percentile market pay, limits retention risk, and shareholder cost. Retention risk is limited because the company does not allow target pay to fall below the 50th percentile, and shareholder cost is limited because the company does not allow target pay to rise above the 50th percentile.

A big rise in pay at risk
In the United States, there has been a growing embrace of this conventional wisdom over the past 30 years. We can see that in the growing percentage of pay at risk and the growing commitment to “competitive pay policy.” For CEOs in the S&P 1500, the average percent of pay at risk rose from 46% in 1993 to 78% in 2023. For other top five executives, the average percent of pay at risk increased from 41% in 1993 to 70% in 2023.
The mix of pay components has also become more standardized, with a quarter of the variation in pay mix across companies disappearing since 2006. (1) Companies frequently cite a high percentage of pay at risk as evidence that they pay for performance.

Growing embrace of competitive pay policy
Competitive pay policy sets target pay equal to a market pay percentile, usually the 50th, regardless of past performance. Market pay is usually defined as median pay for the same position in companies of similar size in the same industry. One sign of a growing commitment to competitive pay policy is that companies are paying closer and closer to the industry-size group median. One recent study found that pay dispersion within industry-size groups had declined by 45% since 2007. (2)
A widely held belief that CEO pay is well-designed
This combination of a rising percentage of pay at risk and a growing commitment to competitive pay policy has led to a widely held belief among corporate directors, compensation consultants, proxy advisors, and institutional investors that U.S. executive pay is well-designed and effective. A leading compensation consulting firm, Pay Governance, said in 2018 that “corporate governance in general and of executive compensation has improved dramatically over the past 20 years.” (3)
The leading proxy advisor, Institutional Shareholder Services (ISS), in its 2024 proxy review, noted that failed say-on- pay resolutions had fallen to a record low (<1% for the S&P 500) and added that “many compensation committees appear to be doing a better job at addressing investor concerns” following a low say-on-pay vote. (4)
Two criticisms are brushed off
The consensus view brushes off two common criticisms. Many observers have highlighted a low correlation between CEO pay and company performance, but the consensus view dismisses the low correlation as irrelevant because the CEO pay reported in the proxy is akin to target pay – which is designed to be independent of performance.
The consensus view is also unconcerned that target dollar pay creates a systematic “performance penalty” – an increase in stock price is penalized by a reduction in equity grant shares, while a decline in stock price is rewarded by an increase in equity grant shares. The consensus view is that there is pay-for-performance because equity grant share value moves up and down with performance after the grant.
New disclosure provides a test of pay for performance
Until last year, there was no way to test the conventional wisdom because equity compensation was never reported on a “mark to market” basis. That changed with the advent of the new “Pay versus Performance” disclosures that report a mark-to- market pay called “Compensation Actually Paid” (CAP). CAP includes the year-end value of current-year equity grants as well as the change in value during the year of unvested grants made in prior years.
There’s pay for performance at some companies but not many
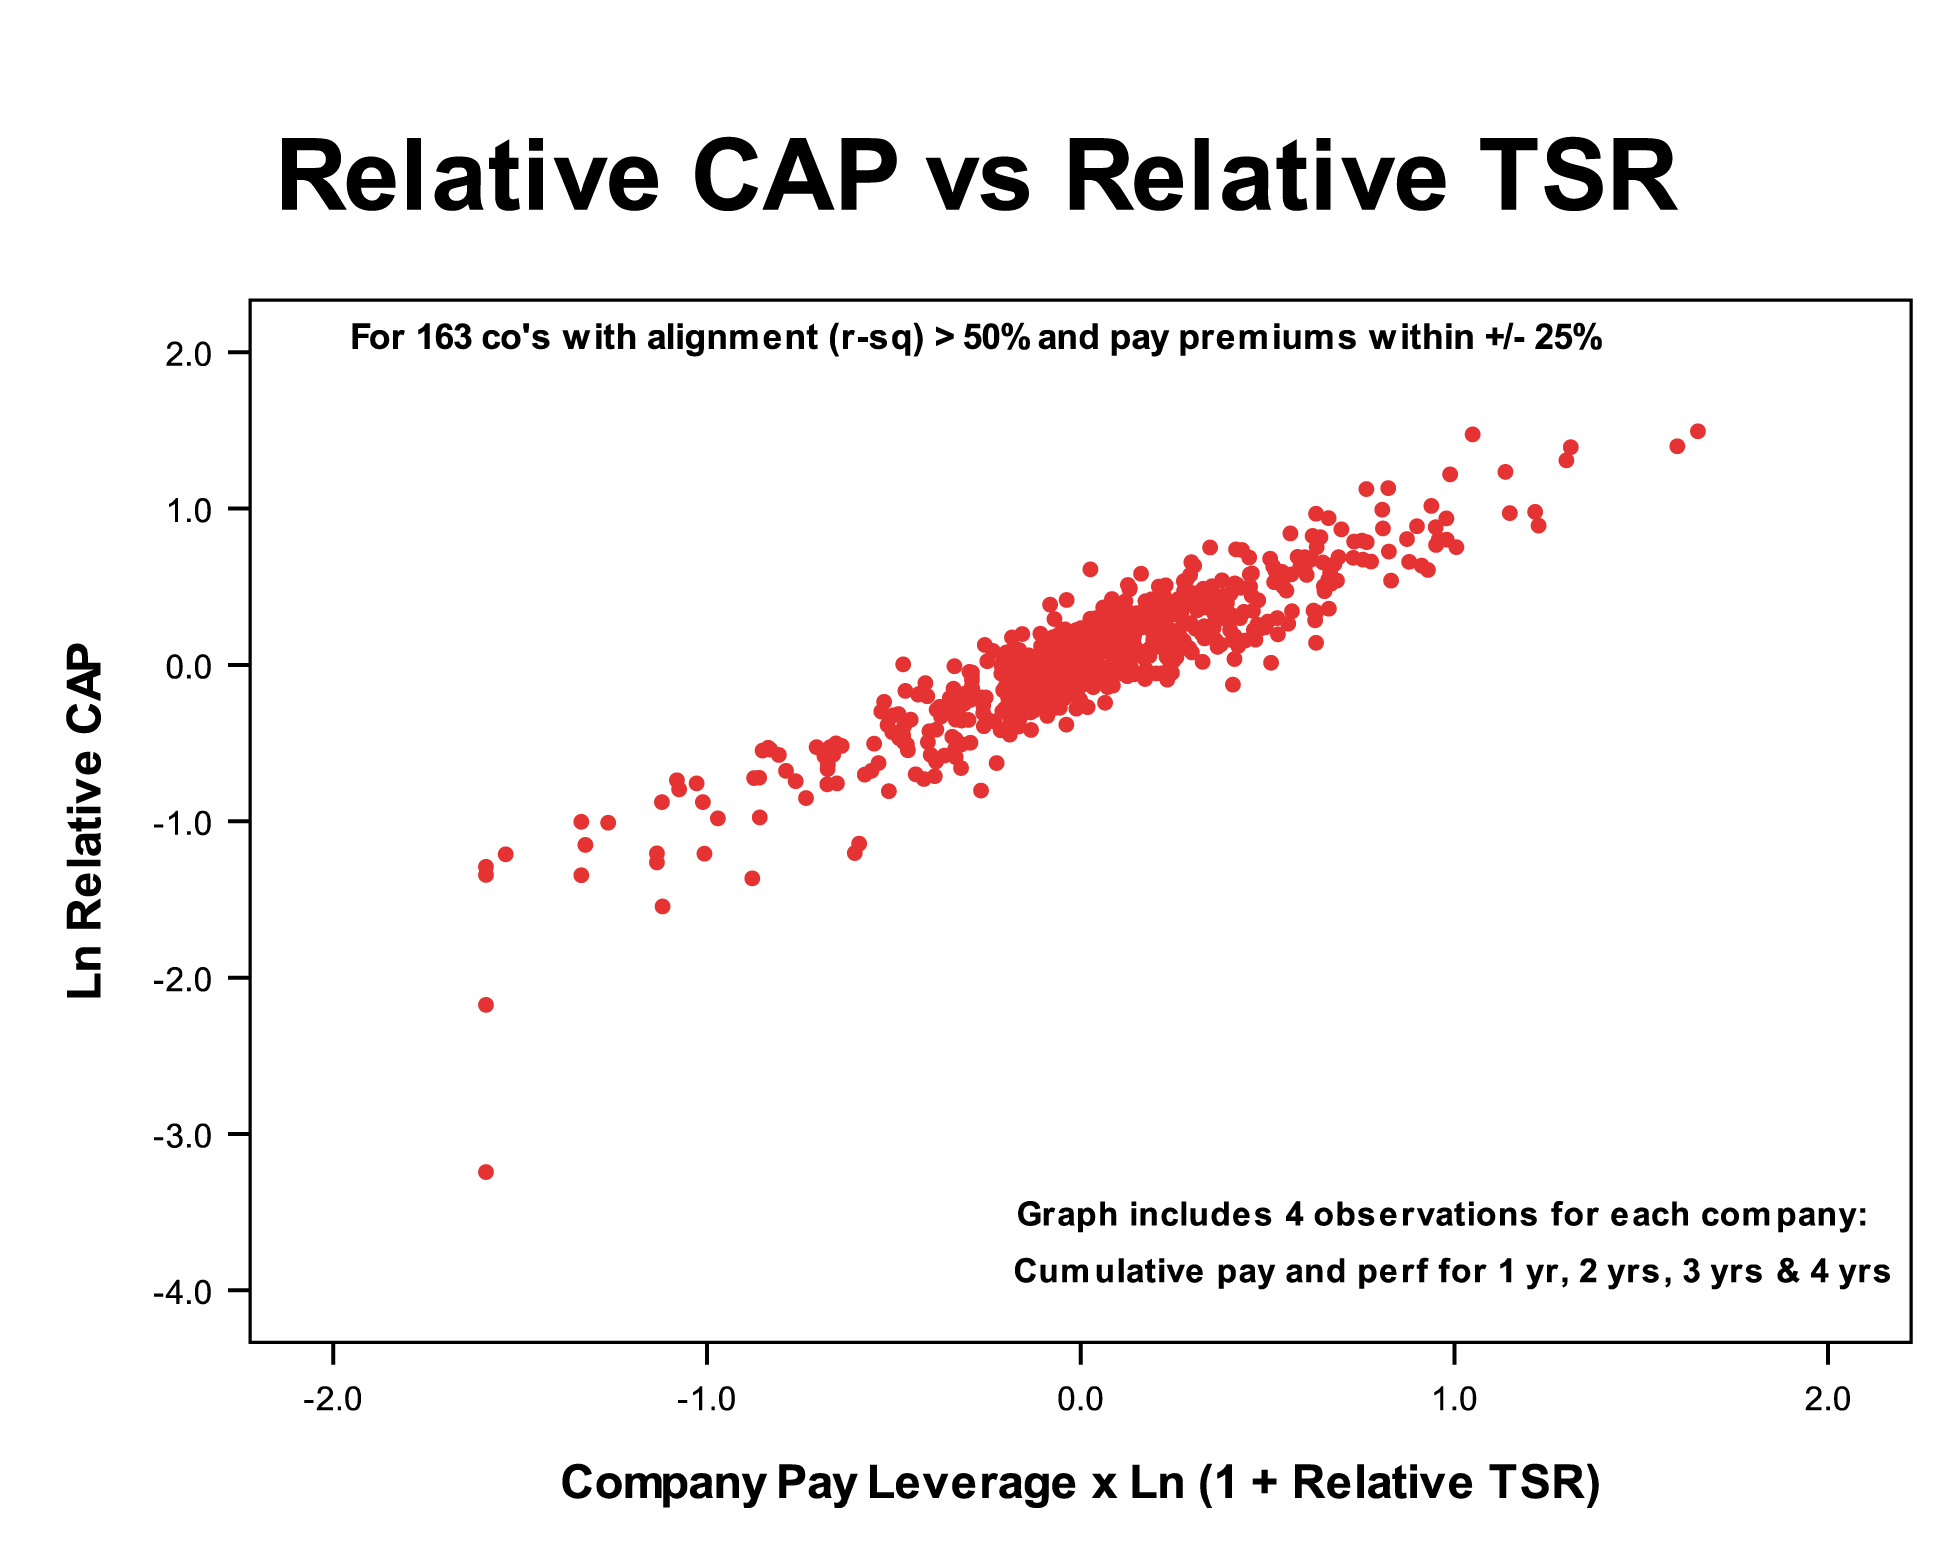
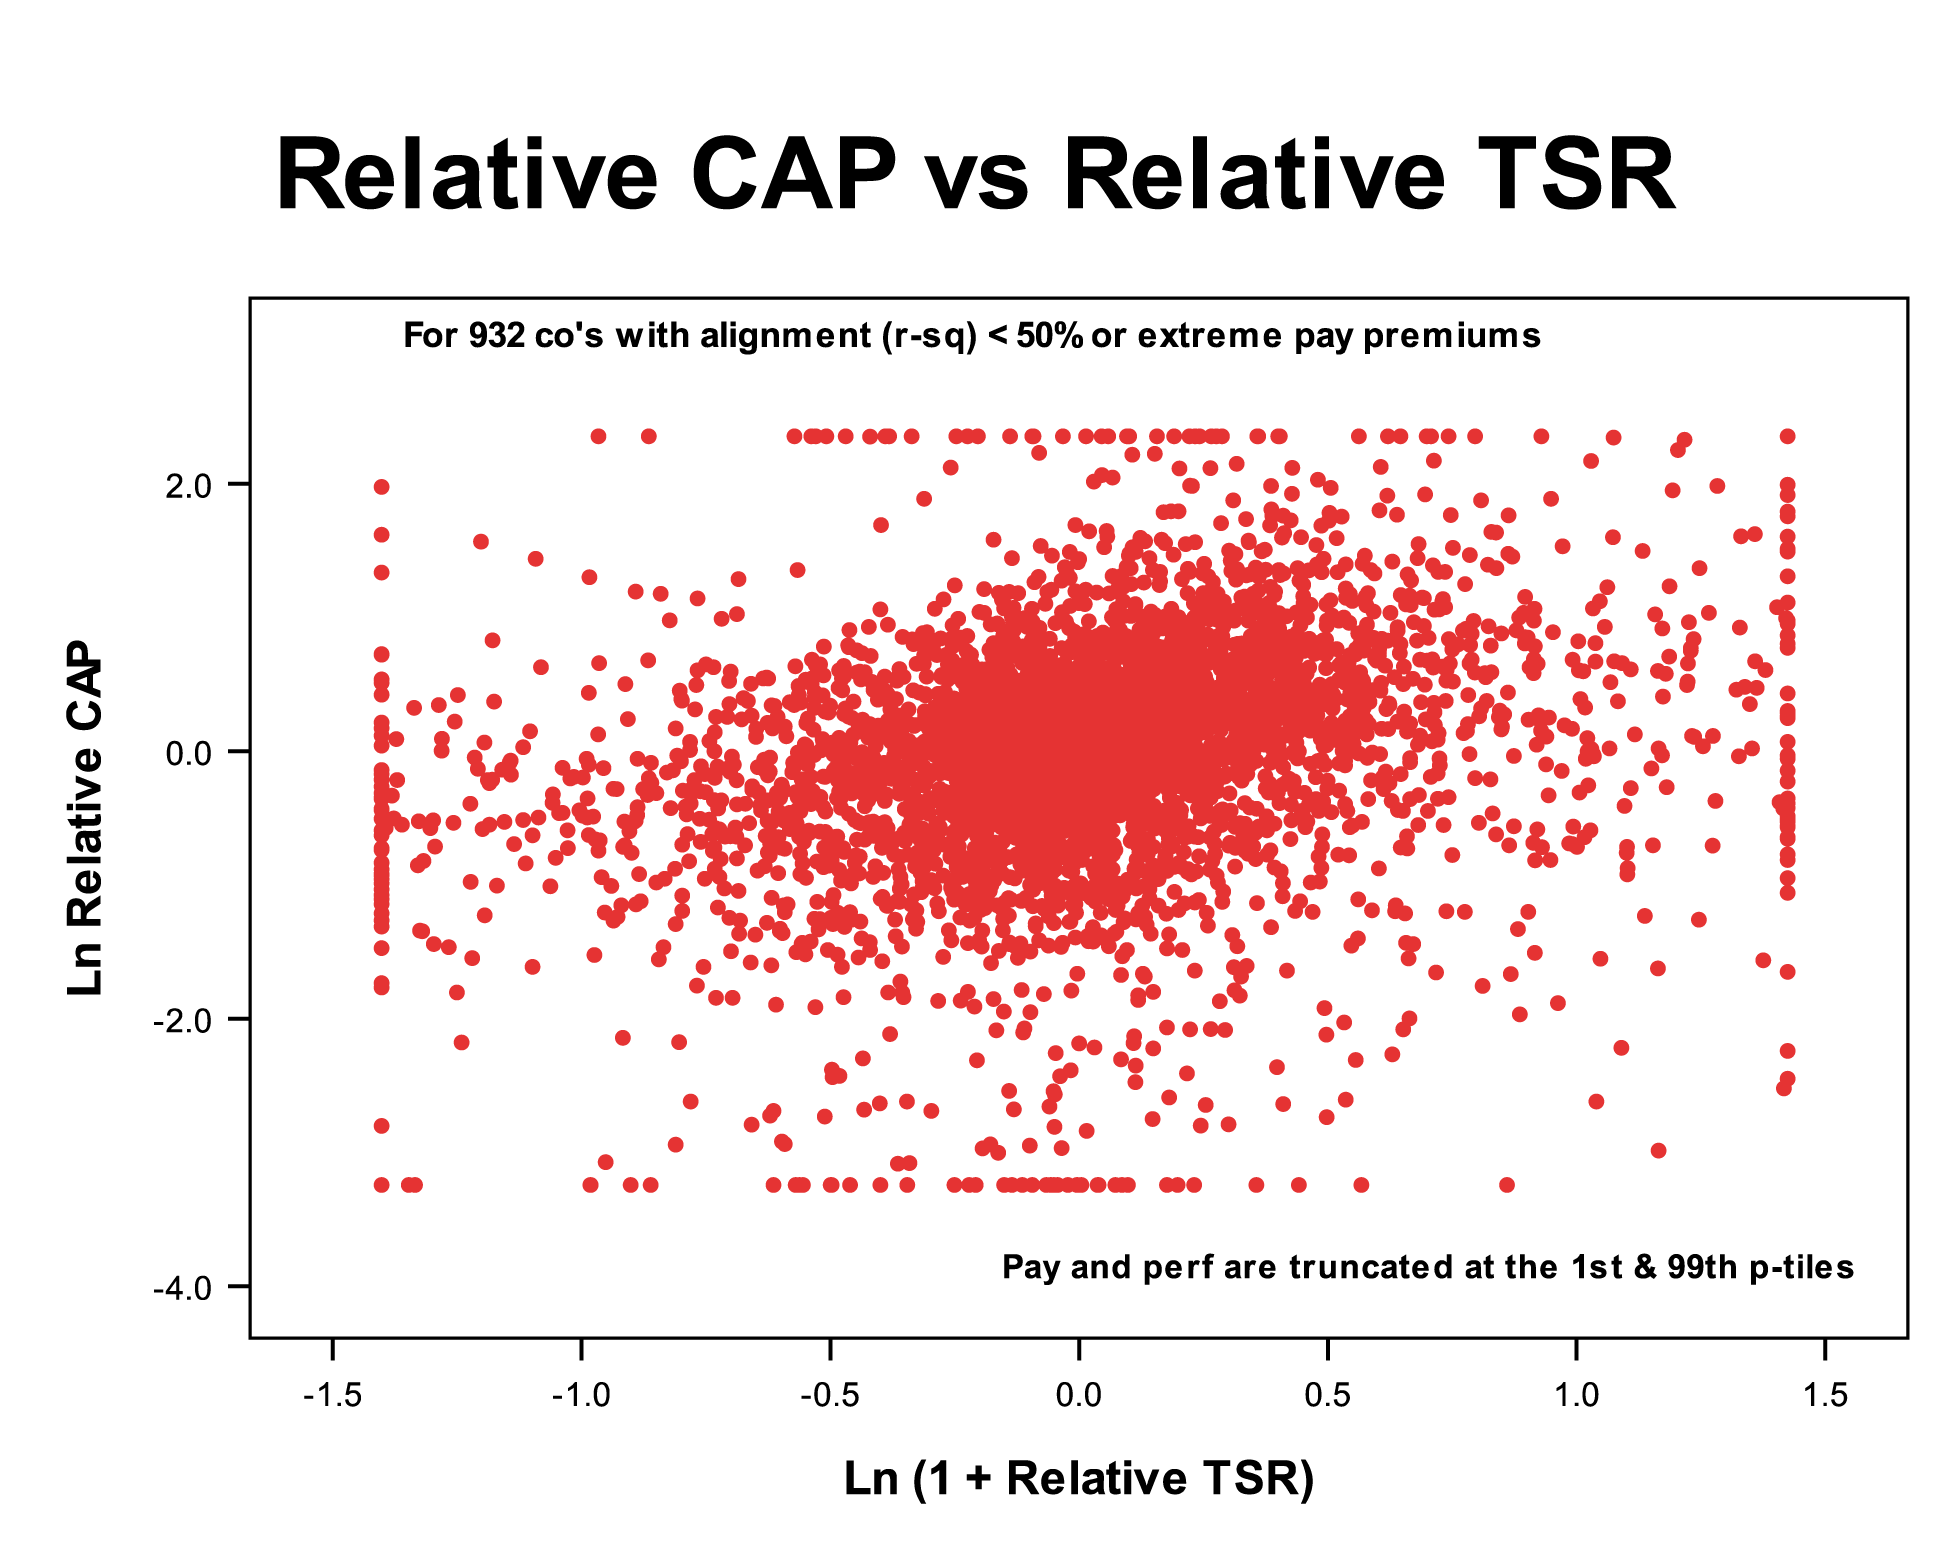
By plotting relative pay against relative total shareholder return (TSR), we can use CAP to measure CEO pay for performance at the individual company level. We can identify “good” companies where relative TSR explains at least half of the variation in relative CEO pay and where the pay premium at industry average performance is modest and “bad” companies that fail one or both of these tests. When we do that, we get two startling pictures and a big challenge to conventional wisdom. Relative TSR explains 82% of the variation in relative pay for the 163 good companies (left panel above) but only 5% for the 932 bad companies. The big challenge for conventional wisdom is that good companies comprise only 15% of the total.
In our next essay, we’ll take a closer look at the good and bad companies, talk more about the impact of the “performance penalty” in equity grants, and look at how the advocates of the conventional wisdom, such as ISS and Pay Governance, are trying to make sense of the new disclosures.
References
- Felipe Cabezon, Executive Compensation: The Trend Towards One-Size-Fits-All, available at ssrn.com/abstract=3727623.
- Torsten Jochen, Gaizka Ormazabal and Anjana Rajamani, Why Have CEO Pay Levels Become Less Diverse, available at ssrn.com/abstract=3716765.
- Pay Governance, Viewpoint on Executive Compensation: CEO Pay As Governed by Compensation Committees: The Model Works”, April 12, 2018, p. 2.
- ISS Governance | Insights, July 31, 2024, “In Focus: Board Elections and Executive Compensation in the 2024 U.S. Proxy Season”, p. 3.


